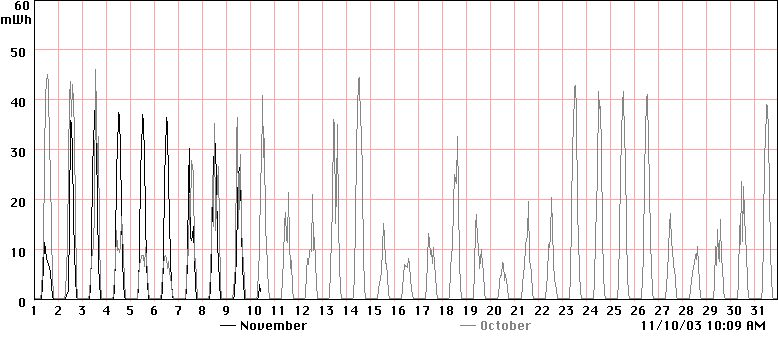

The chart above shows the solar power data for the current month (black) and the previous month (gray) in milliwatt-hours for each hour period.

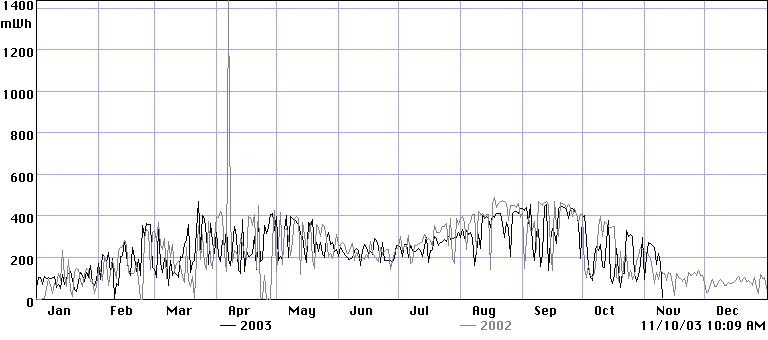
The chart above shows the solar power data for the current year (black) in watts. The values are daily totals in milliwatt-hours per day. On a good day, this rig could generate nearly a watt and a half of power, assuming a good solid 24 hours of sun. Does anybody want to try this out in the arctic?
   |